
Quick Answer: Are Mortgage Rates High by Historical Standards?
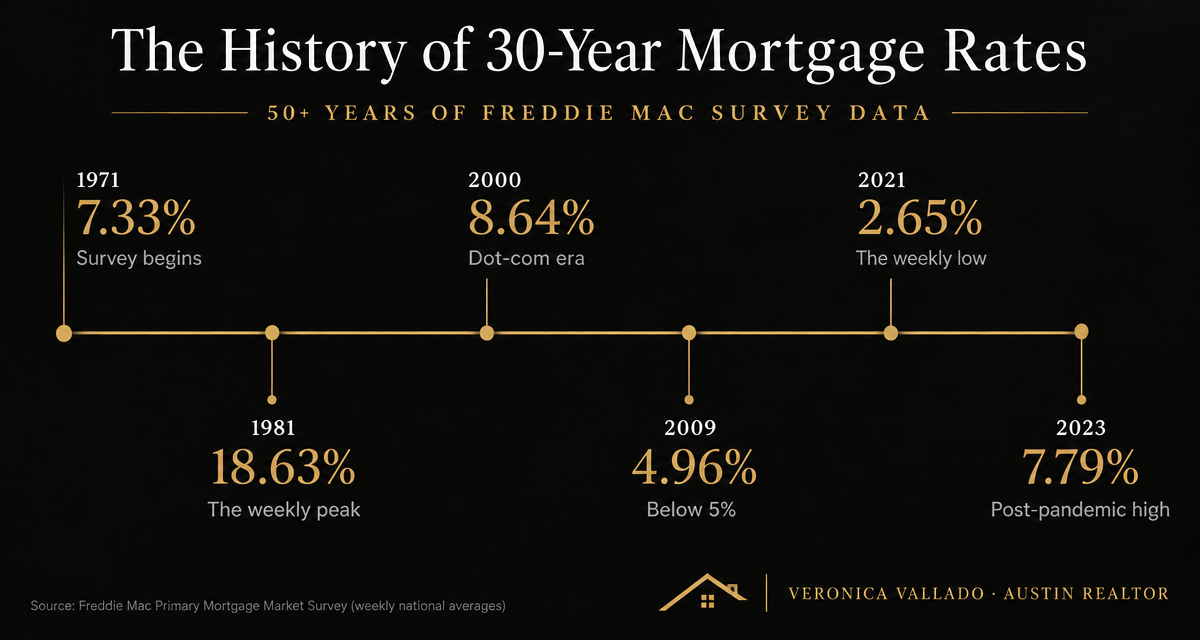
Mortgage rates have moved through very different eras. Freddie Mac's weekly 30-year fixed average reached 18.63% in October 1981 and 2.65% in January 2021. That history offers perspective, but it does not make any particular payment affordable. For an Austin buyer, the useful question is whether the home's price and full monthly cost fit your life at the rate you can actually get.
Published: October 25, 2026 · Data through: December 2025 (completed annual averages) · Last verified: October 25, 2026. This is a historical guide, not a current-rate report.
If you remember the mortgage rates of 2020 and 2021, almost anything higher can feel uncomfortable. That feeling makes sense. But those years are one chapter in a much longer story—not a dependable baseline for every home purchase.
Let's take a calm look at the history of interest rates, specifically U.S. 30-year fixed mortgage rates, and what it means for buyers, sellers, and investors here in Austin, TX. No pressure to rush. No promise that the next rate move solves everything. Just context and a practical plan.
First, Which Interest Rate Are We Talking About?
- Mortgage rate: the interest rate on your home loan. This guide uses Freddie Mac's national 30-year fixed mortgage survey for its timeline.
- Federal funds rate: the overnight interbank rate targeted by the Federal Reserve. It is not the rate on your 30-year mortgage.
- Treasury yield: a return on U.S. government debt. Longer-term Treasury yields help explain mortgage-rate movement, but mortgage rates include additional risks and costs.
These rates influence each other, but they are not interchangeable. Neither are a daily lender index, a weekly survey average, and an annual average. Keeping the source and time period consistent makes the comparison more useful.
The History of Mortgage Rates: Six Turning Points
The survey begins
7.33%April 2, 1971 · Weekly national average
Freddie Mac's first weekly observation anchors the modern 30-year fixed mortgage-rate record.
The weekly peak
18.63%October 9, 1981 · Weekly national average
The inflation-fighting era brought the highest weekly 30-year fixed survey average in this series.
The dot-com era
8.64%May 19, 2000 · Weekly national average
Rates were above 8% during parts of 2000—well before the pandemic-era lows.
Below 5%
4.96%January 15, 2009 · Weekly national average
After the financial crisis, Freddie Mac's weekly 30-year average fell below 5% for the first time.
The weekly low
2.65%January 7, 2021 · Weekly national average
Pandemic-era conditions produced an extraordinary low, not a rate buyers can count on returning.
The post-pandemic reset
7.79%October 26, 2023 · Weekly national average
Freddie Mac's weekly survey reached its 2023 high. Other daily rate trackers used different methods and reported different figures.
Mortgage Rates by Year: A Broader View
The milestones above are individual weeks. These selected annual averages show the wider picture, calculated as the arithmetic mean of Freddie Mac's weekly observations within each year and rounded to two decimal places.
| Year | Average rate |
|---|---|
| 1971* | 7.54% |
| 1981 | 16.64% |
| 1990 | 10.13% |
| 2000 | 8.05% |
| 2010 | 4.69% |
| 2020 | 3.11% |
| 2021 | 2.96% |
| 2023 | 6.81% |
| 2024 | 6.72% |
| 2025 | 6.60% |
Source: Freddie Mac PMMS via FRED, MORTGAGE30US. *1971 covers April 2–December 31 only; the survey did not cover the full year. The 2025 figure is a completed annual average—not a 2026 quote.
Why Rates Changed So Much
The late 1970s and early 1980s: high inflation and the Federal Reserve's effort to bring it under control helped drive borrowing costs sharply higher. The 18.63% peak belongs to that economic setting. It is a historical fact, not a reason to dismiss the payment challenges buyers face today.
The financial crisis: by December 2008, the Fed had lowered its federal funds target to a 0%–0.25% range and had announced purchases of agency debt and mortgage-backed securities. Freddie Mac's weekly mortgage survey first fell below 5% in January 2009. Lower overnight rates alone do not explain the whole change.
The pandemic: in March 2020, the Fed returned its target range to 0%–0.25% and expanded securities purchases as the economy faced a severe shock. Mortgage rates later reached their January 2021 low. Those conditions were unusual; repeating them is not a sound assumption for a household budget.
The post-pandemic shift: inflation, monetary-policy tightening, and changing bond-market expectations pushed borrowing costs higher. Mortgage rates do not wait for a Fed announcement; markets also price in what they expect to happen next.
What the “Historical Average” Can—and Cannot—Tell You
An average depends on its start date, end date, observation frequency, and source. A 1971-to-present average will look different from one covering only the last ten years. A claim such as “rates have averaged about 7.7%” needs a defined calculation window before it can be treated as a verified statistic.
This guide does not use an undated 2026 quote or mix a daily Mortgage News Daily reading into the Freddie Mac weekly timeline. In particular, a daily index reporting 8% in 2023 does not mean Freddie Mac's weekly survey reached 8%; its 2023 high was 7.79%.
Below a long-run average does not mean affordable. Home prices, income, property taxes, insurance, and cash needed at closing all matter. Your lender's national-average headline is not your offer: loan type, down payment, creditworthiness, lender, points, fees, and lock timing affect the actual quote.
My Read: History Should Lower the Temperature, Not Pressure You
I use rate history to widen the conversation—not to tell someone they should be grateful for a payment that stretches their budget. You are buying a home in your own circumstances, not in 1981.
For a home in Mueller, East Austin, Cedar Park, or anywhere from Georgetown to Buda, I want to look at the actual property, neighborhood comparable sales, your timeline, and the terms we can realistically negotiate. The Austin median home price page adds local price context, but a citywide median is not a valuation for an individual home.
- Buyers: start with the full payment at today's available quote, including taxes, insurance, HOA costs where applicable, and mortgage insurance. Keep a savings cushion. A future refinance should be a possibility—not the condition that makes the purchase work.
- Sellers: consider how price, closing-cost assistance, repairs, and eligible seller-paid buydowns affect a buyer's ability to move forward. Compare your net proceeds rather than assuming every concession is better than a price adjustment.
- Investors: underwrite the financing you can obtain now, realistic expenses and vacancy, and the loan's maturity or reset terms. This residential 30-year timeline is not a commercial loan quote.
Negotiating Around Higher Borrowing Costs
There can be more than one way to structure a workable offer. Depending on the property, seller, lender, and loan program, we can explore price, repair credits, closing costs, or a temporary rate buydown.
With an eligible seller-paid 2-1 buydown, funds subsidize the payment using a rate two percentage points below the note rate in year one and one point below it in year two. Your note rate stays the same, and the full scheduled payment returns after the subsidy ends. Ask the lender to show every stage of the payment, qualification requirements, and concession limits.
A temporary buydown may provide more early monthly relief than a similarly sized price reduction, but the benefits are different: a price reduction can lower the loan balance and costs over the loan term. Have the lender compare both in writing. Neither guarantees refinancing or makes an otherwise unaffordable home a safe purchase.
Start with the Buying Power calculator, then get property-specific estimates from a lender. For the wider process, see How to Buy a Home in Austin.
Frequently Asked Questions About Historical Interest Rates
What was the highest 30-year mortgage rate on record?
In Freddie Mac's weekly Primary Mortgage Market Survey, the 30-year fixed mortgage rate reached 18.63% on October 9, 1981. This is a weekly national survey average, not the rate every borrower received.
What was the lowest 30-year mortgage rate on record?
Freddie Mac's weekly 30-year fixed mortgage rate reached 2.65% on January 7, 2021, during the pandemic-era low-rate period. That historical low does not establish a normal rate or promise that rates will return to that level.
Does the Federal Reserve set mortgage rates?
No. The Fed sets a target range for the federal funds rate, an overnight interbank rate. Mortgage rates also reflect longer-term bond yields, inflation expectations, mortgage-backed securities pricing, and lender costs. A Fed cut does not guarantee an equal mortgage-rate cut.
Is a national average mortgage rate the rate I will get?
No. Your quote depends on loan type, down payment, creditworthiness, lender, points, fees, and rate-lock timing. Compare Loan Estimates for the same loan terms and review both the interest rate and APR.
Should I wait for mortgage rates to fall before buying in Austin?
There is no universal answer. Evaluate the home's price, your full monthly ownership cost, savings cushion, time horizon, and local comparable sales. Buy only if the payment works at the rate available to you now; a future refinance is not guaranteed.
Can a seller-paid 2-1 buydown help with affordability?
On an eligible loan, a seller-funded temporary buydown subsidizes payments using a rate two percentage points below the note rate in year one and one point below it in year two. The note rate does not change. Budget for the full payment after the subsidy ends and confirm qualification and concession limits with your lender.
Sources Reviewed
- Freddie Mac: Primary Mortgage Market Survey and FRED: 30-Year Fixed Rate Mortgage Average in the United States—the source for all six weekly timeline observations. Freddie Mac changed its survey methodology in November 2022; long-period comparisons should recognize that change.
- Federal Reserve History: Anti-Inflation Measures—the Volcker-era policy context.
- Federal Reserve: December 16, 2008 statement and November 25, 2008 securities-purchase announcement.
- Federal Reserve: March 15, 2020 statement—pandemic policy actions.
- Consumer Financial Protection Bureau: Owning a Home—loan shopping, Loan Estimates, and ownership-cost considerations.
Historical rates are educational national benchmarks, not a commitment to lend, a prediction, or an individual quote. This article is general information, not personalized lending, tax, or investment advice.
Let's Put the Numbers in Your Context
Thinking about buying, selling, or investing in Greater Austin? We can look at your timeline, the property, and the questions to take to your lender—calmly, without guessing where rates go next.