
Published: September 15, 2026 · Data through: August 2026 (Unlock MLS Central Texas Housing Report, released September 15, 2026) · Last verified: November 8, 2026
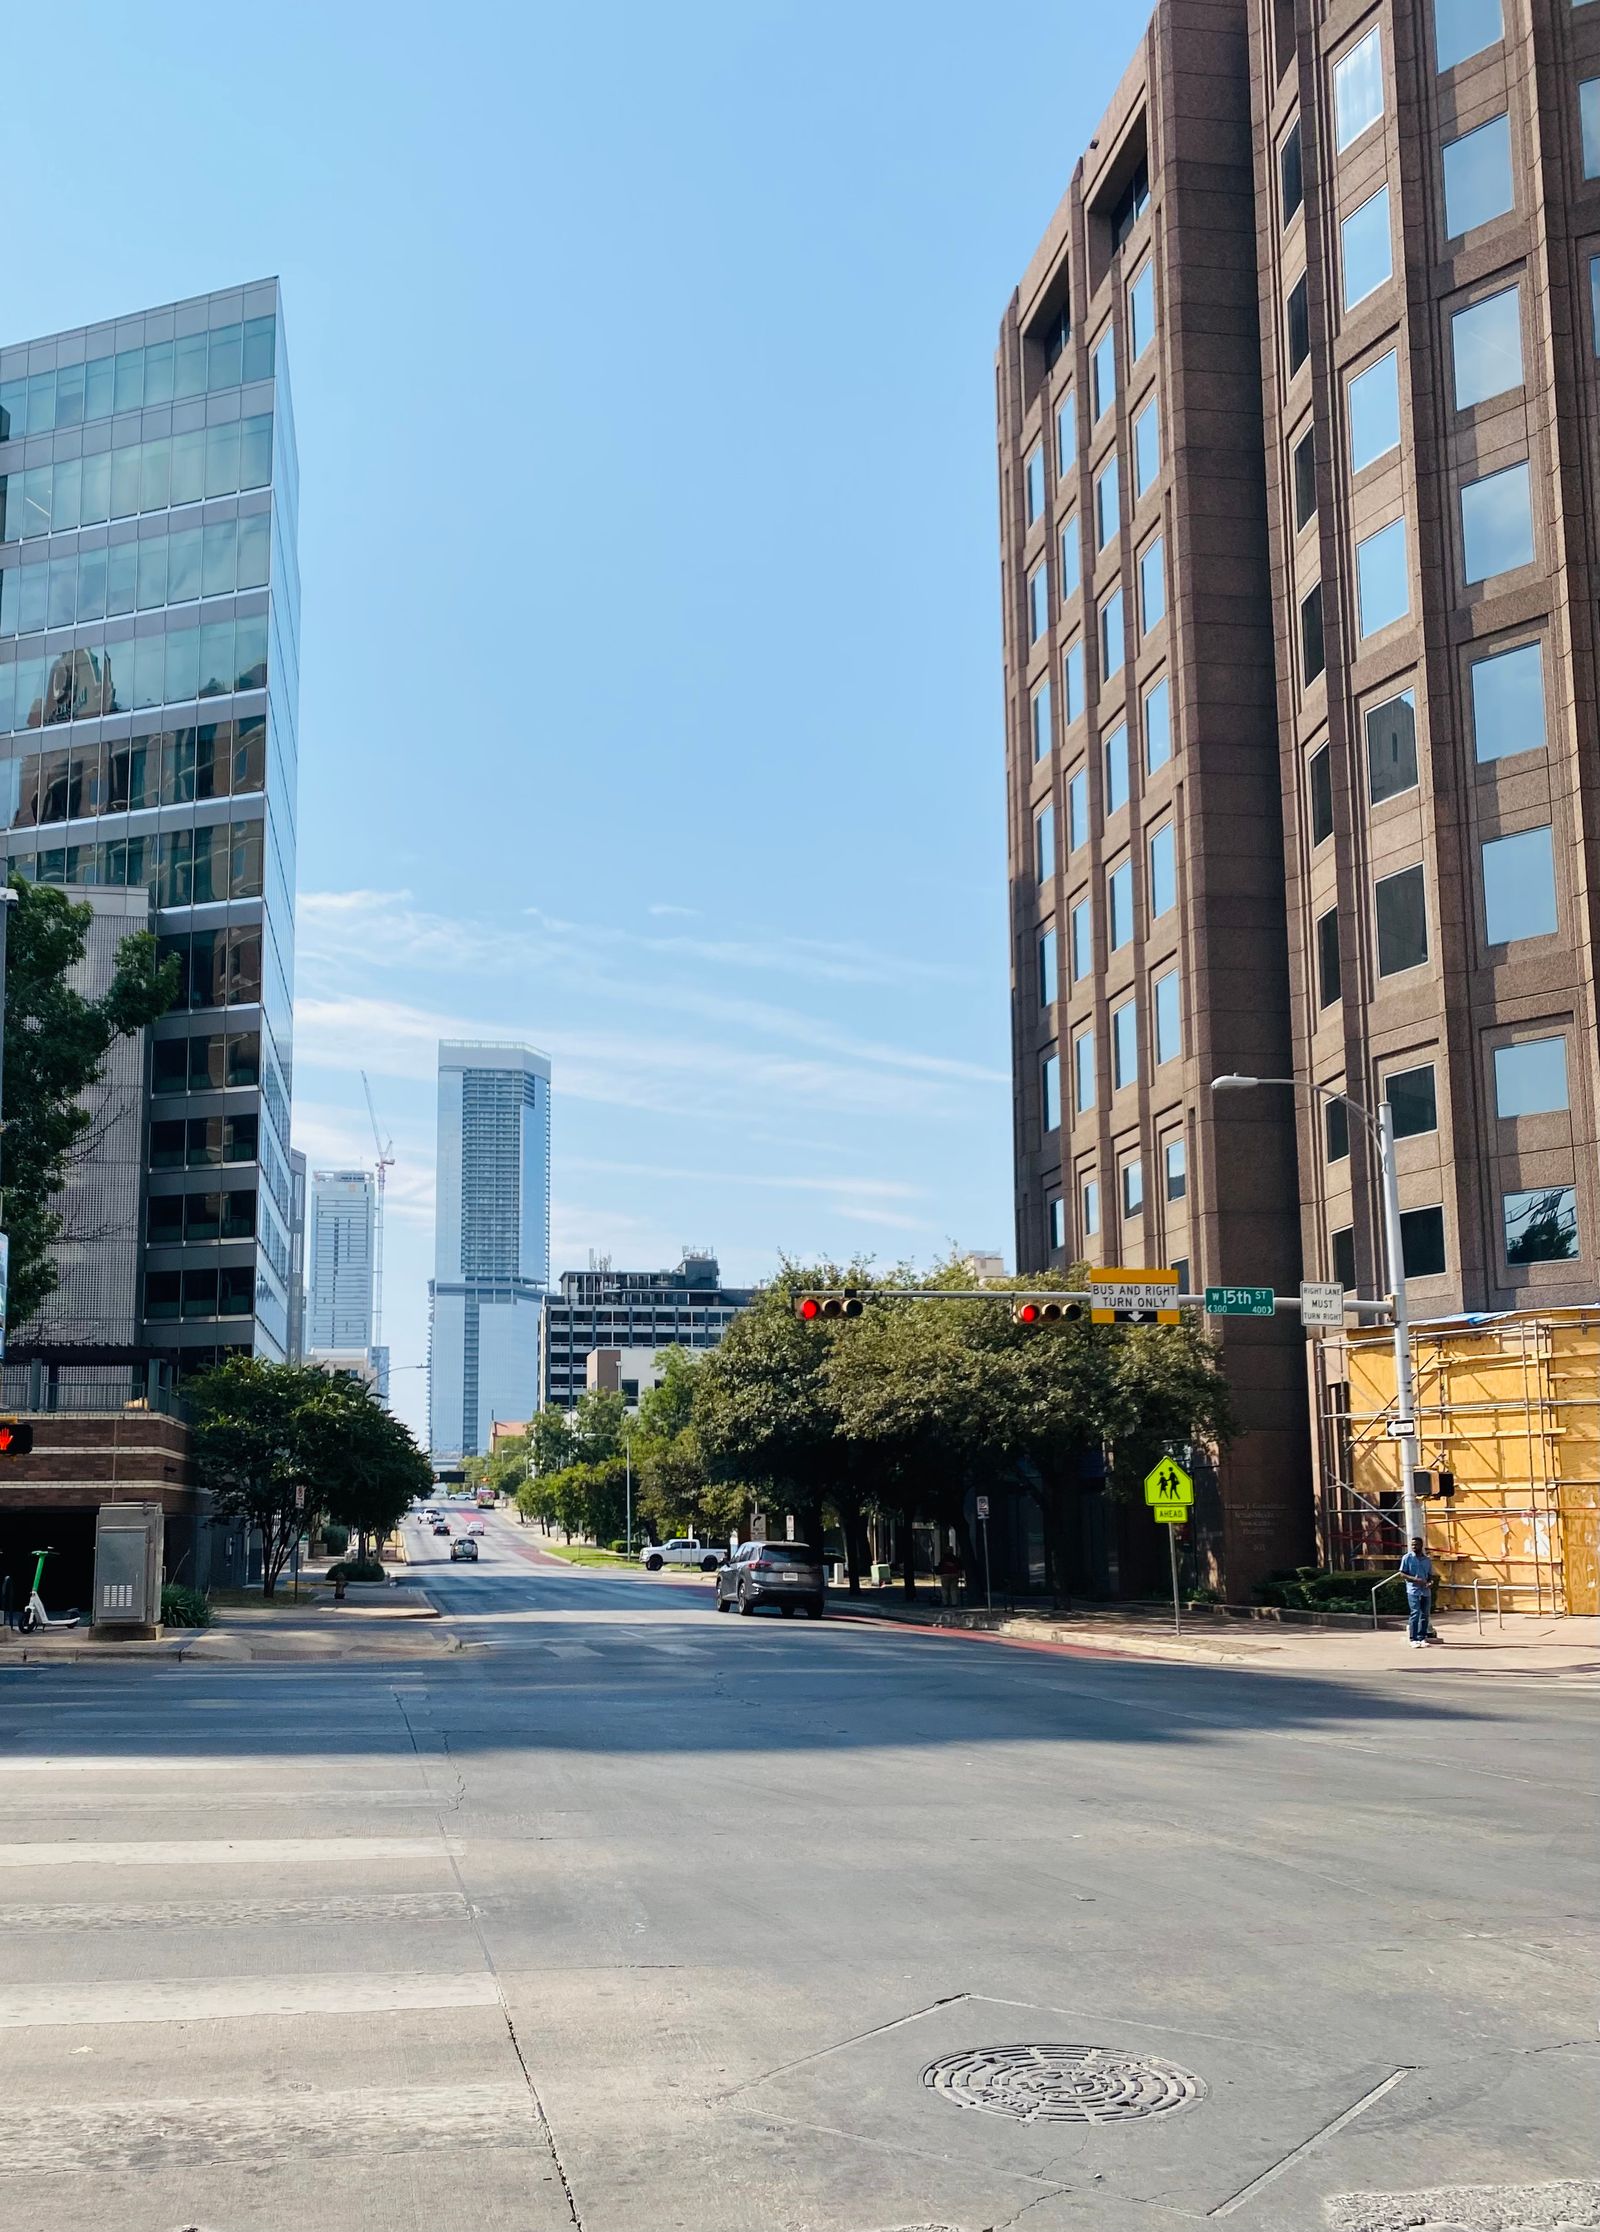
Quick Answer: What Happened in the Austin Housing Market in August 2026?
Unlock MLS reported a $412,000 median price across the Austin-Round Rock-San Marcos metro in August 2026 (down 6.4% year over year) and $560,000 inside Austin city limits (down 4.3%). Closed sales fell 7.3% metro-wide, but pending sales rose 1.5%. Inventory sat at 5.1 months in the metro and 4.6 months in the city, with homes closing at about 93% of list price. In short: a slower, more negotiable month — not a frozen one.
The Verified Numbers: Austin Metro, August 2026
Every figure in this section comes straight from the Unlock MLS August 2026 Central Texas Housing Report. Year-over-year comparisons are the cleanest read, because Austin's market has a strong seasonal rhythm — late summer is usually quieter than spring.
- 2,501 — Residential homes sold, 7.3% less than August 2025.
- $412,000 — Median price, 6.4% less than August 2025.
- 3,579 — New listings, 7.0% less than August 2025.
- 13,676 — Active listings, 6.5% less than August 2025.
- 2,623 — Pending sales, 1.5% more than August 2025.
- 5.1 — Months of inventory, 0.4 less than August 2025.
- $1.40 billion — Total dollar volume, 11.1% less than August 2025.
- 93.2% — Average close-to-list price, compared with 92.2% in August 2025.
The Verified Numbers: City of Austin, August 2026
- 844 — Residential homes sold, 10.3% less than August 2025.
- $560,000 — Median price, 4.3% less than August 2025.
- 1,249 — New listings, 5.7% less than August 2025.
- 4,554 — Active listings, 14.5% less than August 2025.
- 814 — Pending sales, 9.2% less than August 2025.
- 4.6 — Months of inventory, 1.1 less than August 2025.
- $649 million — Total dollar volume, 10.9% less than August 2025.
- 93.3% — Average close-to-list price, compared with 91.6% in August 2025.
County by County, From Georgetown to Buda
Greater Austin never moves as one block. Here is how each county in the report looked in August (year-over-year change in parentheses):
| Area | Homes sold | Median price | Pending sales | Months of inventory |
|---|---|---|---|---|
| Travis County | 1,111 (−9.5%) | $489,000 (−6.4%) | 1,136 (−1.1%) | 5.1 |
| Williamson County | 855 (−4.1%) | $399,900 (−5.9%) | 960 (+9.3%) | 4.6 |
| Hays County | 396 (−8.1%) | $355,000 (−1.4%) | 346 (−13.5%) | 5.5 |
| Bastrop County | 98 (−14.8%) | $342,495 (−5.1%) | 134 (+8.9%) | 7.4 |
| Caldwell County | 41 (+24.2%) | $270,000 (+17.4%) | 47 (+34.3%) | 7.3 |
Source: Unlock MLS August 2026 Central Texas Housing Report. Caldwell County is a small sample (41 sales), so its percentage swings can be large from one month to the next.
Rentals: Fewer Listings, Steady Prices
On the lease side, the metro median rent for leases closed through the MLS was $2,150, flat with August 2025, and the City of Austin median was $2,200, down 4.3%. Active lease listings fell 27.9% metro-wide and 28.8% in the city, with about 1.6 months of rental inventory across the metro.
What Changed Since July
| Measure (Unlock MLS) | July 2026 | August 2026 |
|---|---|---|
| Metro median price | $435,000 | $412,000 |
| City of Austin median price | $577,000 | $560,000 |
| Metro months of inventory | 4.7 | 5.1 |
| City months of inventory | 4.5 | 4.6 |
| Metro close-to-list price | 93.7% | 93.2% |
| Metro pending sales | 2,833 | 2,623 |
Month-to-month moves include normal seasonal cooling as families settle in for the school year, so I read them alongside the year-over-year figures above rather than on their own. A median also shifts with the mix of homes that happen to close in a given month — it is a market midpoint, not the value of any single home.
On financing, Freddie Mac's weekly survey put the national 30-year fixed average at 6.65%–6.69% through August and 6.76% on September 10. That is a national average quote; your rate depends on loan type, down payment, credit profile, and lender. The Federal Reserve's September 16 decision was the next big event on the calendar when this report came out — you can read what the Fed decided and what it means for Austin.
My Read on August
What stands out to me is that sellers stepped back about as much as buyers did. New listings fell 7% and active listings fell 6.5% metro-wide, so the homes that did come to market weren't fighting a flood of competition. The 1.5% rise in metro pending sales tells me plenty of people are still deciding to move — they are just being more careful about the payment.
Williamson County is the one I'd point to: pending sales up 9.3% while prices eased, which fits what I hear from families comparing Round Rock, Georgetown, Leander, and Hutto with closer-in Austin. Inside the city, fewer pendings suggest a more cautious fall for central neighborhoods.
None of this is a prediction. Current data does not point to a sudden swing either way, but future prices remain dependent on interest rates, inventory, employment, construction activity, and buyer demand.
What It Means for You
- Buyers: With homes closing around 93 cents on the dollar of list price on average, there is room to discuss price, repairs, closing costs, or an eligible seller-paid 2-1 buydown. Run your full monthly payment first with the Buying Power calculator, then talk to a lender.
- Sellers: Price to this fall's comparable sales, not 2022's. Fewer competing listings help, but buyers are comparing carefully. Preparation, condition, and a clear plan for concessions matter. Start with What's Your Home Worth?
- Investors: Lease inventory is tight and rents are steady, but stress-test every deal at today's financing costs rather than a hoped-for refinance.
- Relocating for work: If you are weighing commute zones and school districts, my Greater Austin relocation guide walks through renting first vs. buying.
Frequently Asked Questions: Austin Housing Market, August 2026
What was the median home price in Austin in August 2026?
According to Unlock MLS, the median price for residential homes was $412,000 across the Austin-Round Rock-San Marcos metro in August 2026, 6.4% less than August 2025. Inside Austin city limits the median was $560,000, 4.3% less than a year earlier.
Is Austin a buyer's or seller's market in August 2026?
Unlock MLS reported 5.1 months of inventory across the metro and 4.6 months in the City of Austin. Homes closed at an average of 93.2% of list price metro-wide and 93.3% in the city. Conditions vary by neighborhood and price point, so local comparable sales matter more than a single label.
Did Austin home sales go up or down in August 2026?
Closed sales went down: 2,501 metro sales, 7.3% fewer than August 2025, and 844 City of Austin sales, 10.3% fewer. Metro pending sales rose 1.5% to 2,623, while City of Austin pending sales fell 9.2% to 814.
Are there fewer homes for sale in Austin than last year?
Yes. Active listings were 13,676 across the metro in August 2026, 6.5% fewer than August 2025, and 4,554 in the City of Austin, 14.5% fewer. New listings also fell 7.0% in the metro and 5.7% in the city.
What did Austin rents do in August 2026?
Among leases closed through the MLS, the metro median rent was $2,150, flat with August 2025, and the City of Austin median was $2,200, down 4.3%. Active lease listings fell 27.9% metro-wide.
Sources Reviewed
- Unlock MLS: August 2026 Central Texas Housing Report (released September 15, 2026) — all sales, listing, inventory, close-to-list, county, and lease figures.
- Freddie Mac Primary Mortgage Market Survey via FRED — weekly national 30-year fixed averages.
Market figures are reported by Unlock MLS and may be revised. Medians describe the overall market and are not an appraisal of any home. This is general information, not lending, tax, or investment advice.
Keep Reading
- Austin housing market, September & Q3 2026 — the next month's report.
- Austin housing market, July 2026 — the previous month.
- Austin median home price, month by month
- Are Austin home prices back to pre-pandemic levels?
Let's Look at Your Corner of Austin
Metro numbers are a starting point. If you're thinking about buying, selling, or investing anywhere from Georgetown to Buda, I'm happy to walk through what's happening on your street — no pressure, just the numbers and your goals.